

The ongoing war in Russia has counterintuitively been one of the most significant bearish catalysts in the black gold– Russia floods the market of Oil to countries like India to sponsor its war, prompting threats from Trump.
The war may continue despite the Trump-Putin meeting, with Ukrainian President Zelenskyy announcing that it would be “impossible” to concede land, mentioning Crimea.
As a matter of fact, Ukraine landed hits on one of the key pipelines taking Russian Oil to Hungary, leaving the Hungarian PM Orbán in fury (He is one of the only pro-Russian leaders in Europe).
In the Middle East, on the other hand, Hamas is getting cornered into a ceasefire deal as it fears pressure from Israel to retake complete control of Gaza.
We are expecting more headlines on these developments.
If Iran, which is also selling lots of Oil to sponsor its proxies like Hamas and the Houthis in Yemen, were to reduce supply.
Let’s have a look at US Oil to spot why these factors coincide with a potential short or long-term bottom in the energy commodity.
US Oil technical analysis
US Oil 8H Chart

Looking out to the 8H chart looks at the most recent move down that is finding support at the $62.20 level after forming a double bottom.
The 8H RSI is also forming a bullish divergence as prices are now rallying. Let’s have a closer look.
US Oil 4H Chart
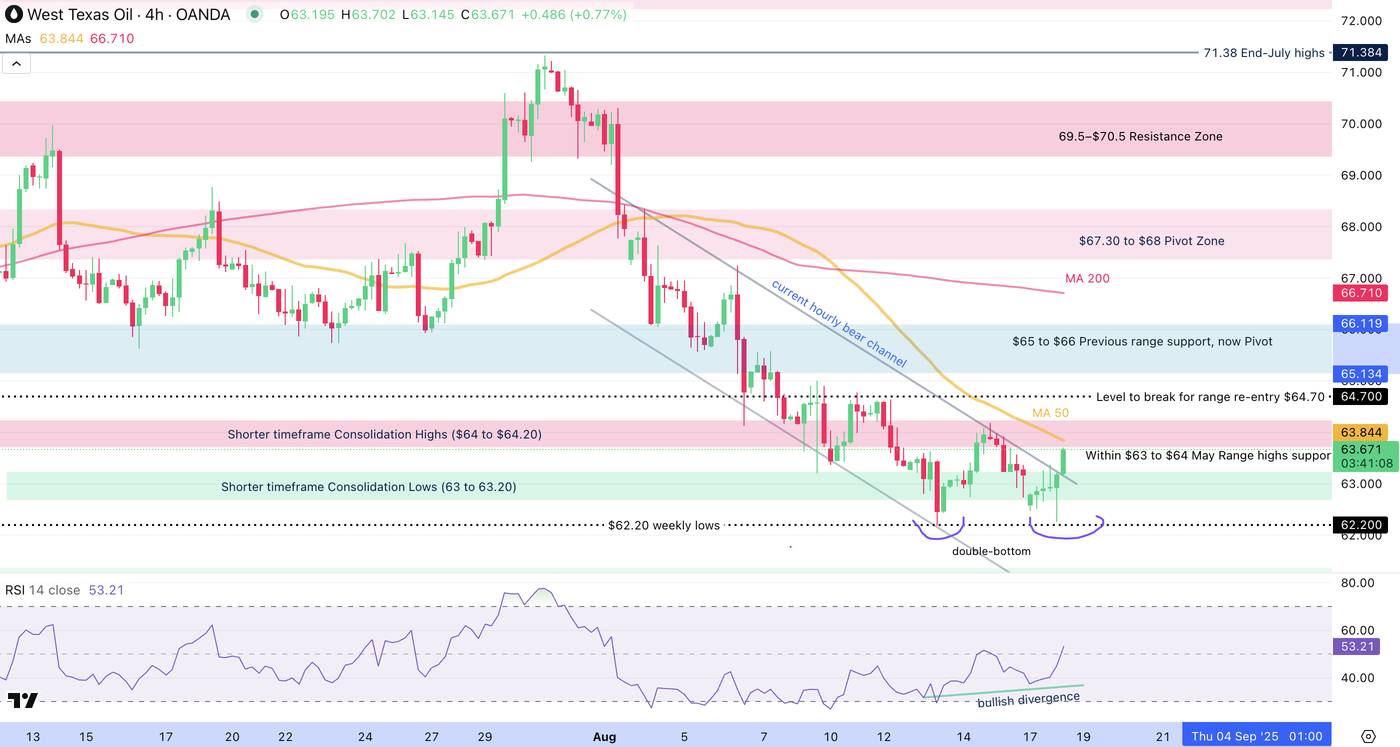
Looking closer shows more detail of the ongoing breakout in WTI.
The most recent up-move is finding some form of resistance at the 50-period MA but bulls have pushed outside of the downwards hourly channel. You can also look at the 4H RSI confirming the bullish divergence.
Bulls are looking to break $64.70 to re-enter the prior month range, point after which the bearish momentum will be absent.
Levels to place on your charts for US Oil trading:
Resistance Levels
- 63.84 imminent resistance/pivot (break above = more bullish) at the 4H 50 MA.
- $66 to $67 Mid-range level
- high range resistance $67.30 to $68 – Confluence with 50 and 200 Day MAs
Support Levels
- $62.00 to $63 May Range highs support
- Wednesday lows $62.19 (current double bottom)
- $60.5 Low of May Range
- $55 to $57 2025 lows Main support
US Oil 1H Chart
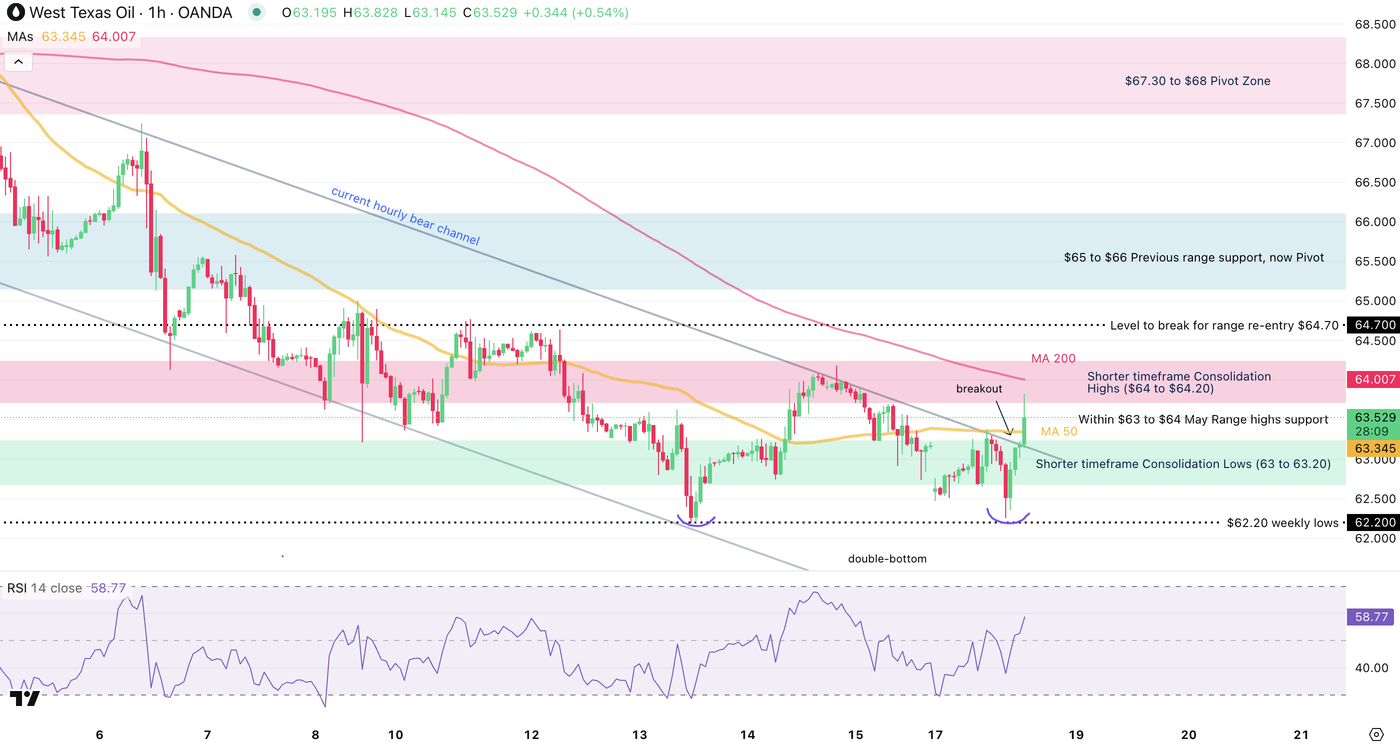
Since the beginning of the morning session, bears have given up the short-term momentum.
Prices are trying to push within the $64 resistance zone, acting as immediate pivot.
It will be essential to see how markets react around that zone as it also was a point of breakout during the Israel-Iran tensions.
Furthermore, the 200-Hour MA is acting as resistance there, if broken, there won’t be much acting as resistance before the middle of the prior month range. ($66 to $67).
Safe Trades!
Opinions are the authors’; not necessarily that of OANDA Business Information & Services, Inc. or any of its affiliates, subsidiaries, officers or directors. The provided publication is for informational and educational purposes only.
If you would like to reproduce or redistribute any of the content found on MarketPulse, an award winning forex, commodities and global indices analysis and news site service produced by OANDA Business Information & Services, Inc., please refer to the MarketPulse Terms of Use.
Visit https://www.marketpulse.com/ to find out more about the beat of the global markets.
© 2025 OANDA Business Information & Services Inc.
About the Author

Elior Manier
Market Analyst
Elior brings over seven years of experience in financial markets to our analyst team. Since 2018, he has actively engaged in observing, charting, and trading, driven by his passion for mastering market dynamics. With a profound understanding of the geopolitical and macroeconomic forces that shape market movements, Elior focuses on analysing the impact of breaking news, market sentiment, and critical economic data releases on trading flows.
As a versatile analyst, he contributes powerful insights to the team, effectively integrating geopolitical and technical analysis to provide clear and comprehensive market perspectives.
Prior to joining our team, Elior honed his expertise as a Fixed Income Trader and Market Analyst at the Montreal Exchange.


Leave a Reply