

Oil has been one of the least performing commodities throughout 2025, despite being subject to heightened volatility.
While it saw spikes in June 2025 following the Iran-Israel 12-day war (from $63 to $78!) and bouts of Ukraine-Russia related news, bearish fundamentals have largely brought the commodity lower.
The combination of several major factors has kept selling pressure on Oil:
- Economic sanctions designed to hurt Russian exports
- A general slowdown in global trade
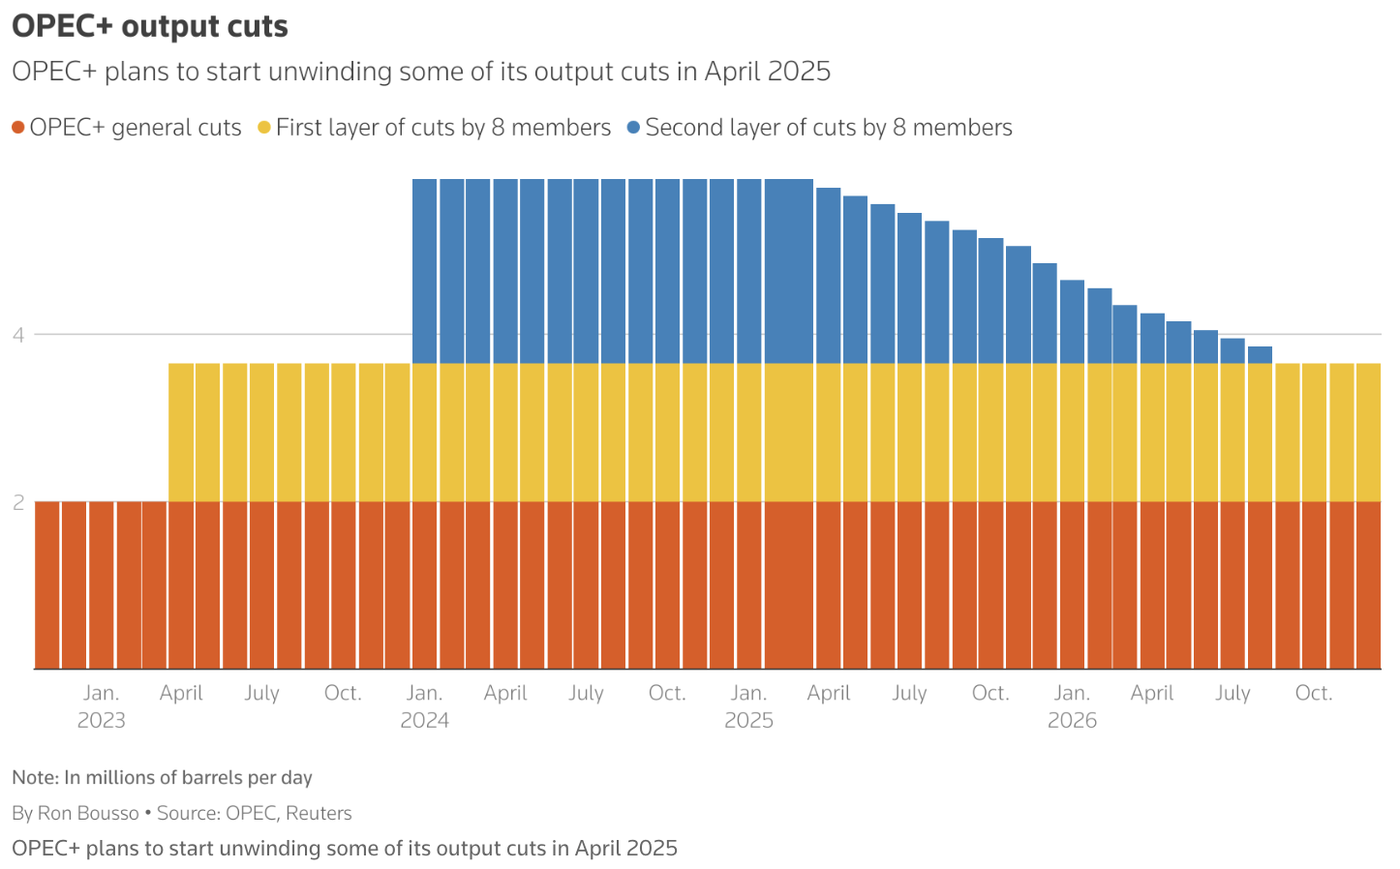
- Higher outputs from OPEC+ members who have been flooding the market due to internal issues.
Consequently, Crude has been consistently sold off on most price pops but that is looking back – Traders need to be forward looking.
Although prices remain technically higher than the April 2025 post-Liberation dip, price action remains highly undecided right around the $60 key psychological support mark.
As the market is wrestles around this level, let’s dive into a multi-timeframe analysis for black gold to see if technical elements allow a shift in balance.
US Oil multi-timeframe technical analysis
Daily Chart
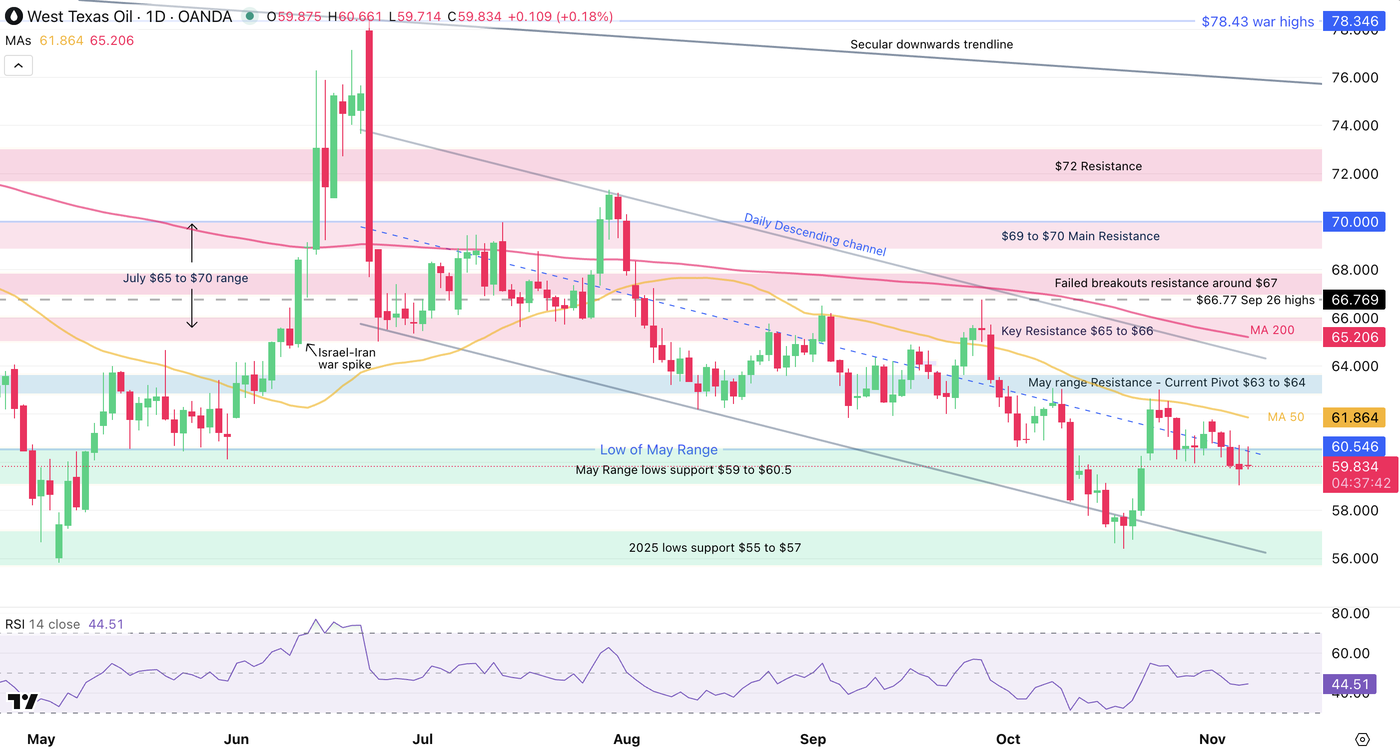
Crude evolves within a daily downwards channel and despite an October-end rebound at its bottom shaking prices out of the ~$50 handle, candles are still hovering around the middle/lower bound of the channel.
Small indecision daily candles are compressing volatility as prices hang at the key $60 level – Pivot during a May 2025 consolidation.
RSI momentum is also not showing many signs of decision, so let’s have a closer look.
4H Chart and technical levels
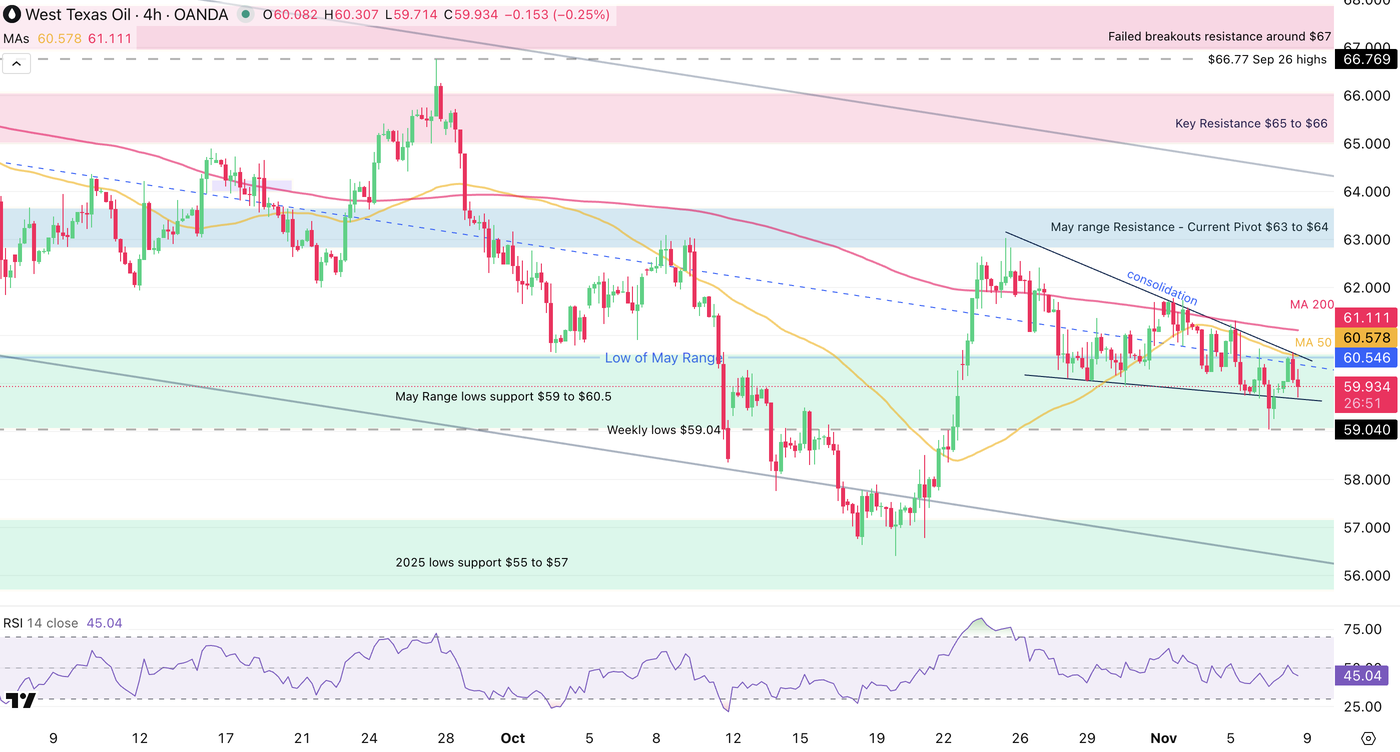
Levels to place on your WTI charts:
Resistance Levels
- 4H MA 50 $61.87
- May range Resistance – Current Pivot $63 to $64 (past week highs)
- Key Resistance $65 to $66 (200 MA $65.20)
- Resistance around $67
- $69 to $70 Main Resistance
Support Levels
- May Range lows support $59 to $60.5 (Immediate support)
- Weekly lows $59.042
- 2025 lows support $55 to $57
- 2019 support $53 to $54
- Mid-2019 Main support $51 to $52.5
1H Chart
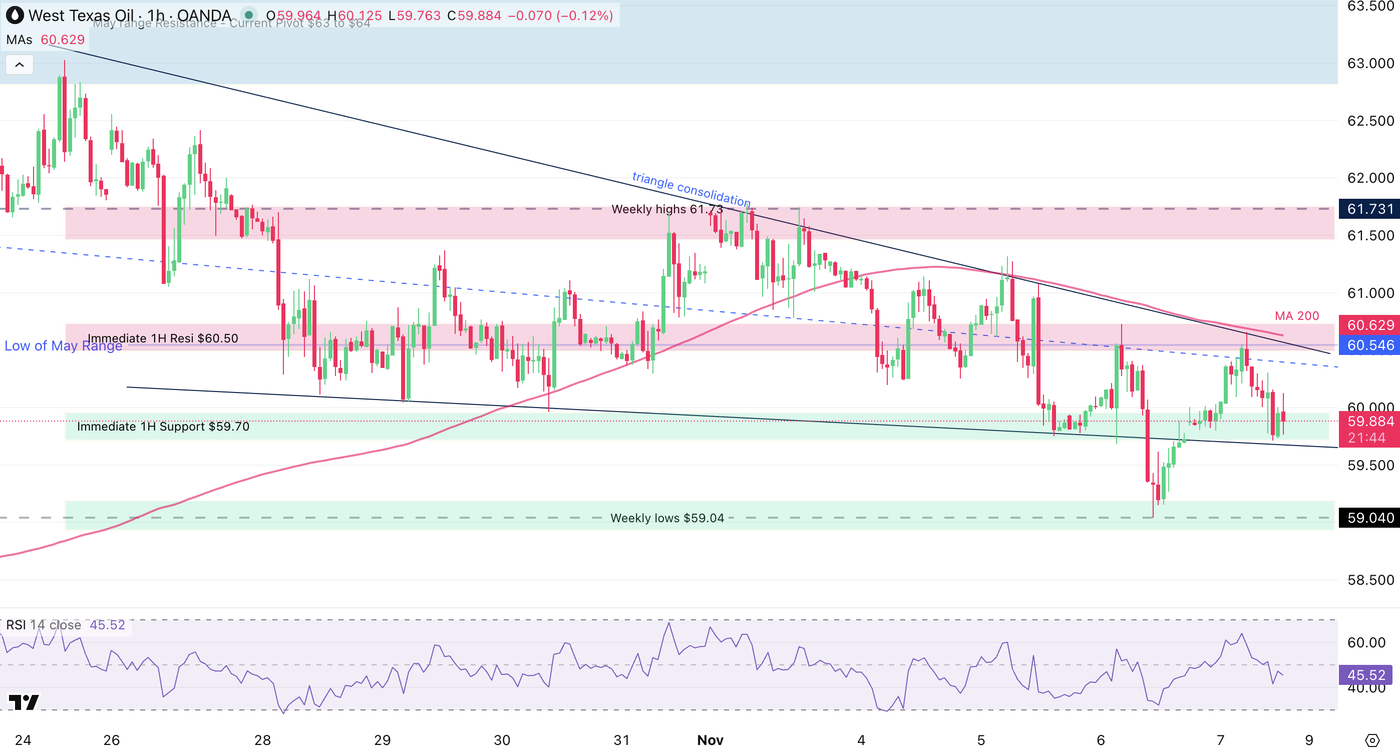
Current price action is hanging within a consolidation triangle – Yesterday’s breakdown attempt got rejected which adds a layer of support ($59)
Monitor the 1H support and resistance zones:
- Watch for any break above the weekly highs ($61.40)
- On the lower side, watch for a break below $59
- To confirm, look for session closes
Overall, the price action still looks like one of converging prices around $60 which may allow for some interesting range plays.
Safe Trades!
Follow Elior on Twitter/X for Additional Market News, interactions and Insights @EliorManier
Opinions are the authors’; not necessarily that of OANDA Business Information & Services, Inc. or any of its affiliates, subsidiaries, officers or directors. The provided publication is for informational and educational purposes only.
If you would like to reproduce or redistribute any of the content found on MarketPulse, an award winning forex, commodities and global indices analysis and news site service produced by OANDA Business Information & Services, Inc., please refer to the MarketPulse Terms of Use.
Visit https://www.marketpulse.com/ to find out more about the beat of the global markets.
© 2025 OANDA Business Information & Services Inc.
About the Author

Elior Manier
Market Analyst
Elior brings over seven years of experience in financial markets to our analyst team. Since 2018, he has actively engaged in observing, charting, and trading, driven by his passion for mastering market dynamics. With a profound understanding of the geopolitical and macroeconomic forces that shape market movements, Elior focuses on analysing the impact of breaking news, market sentiment, and critical economic data releases on trading flows.
As a versatile analyst, he contributes powerful insights to the team, effectively integrating geopolitical and technical analysis to provide clear and comprehensive market perspectives.
Prior to joining our team, Elior honed his expertise as a Fixed Income Trader and Market Analyst at the Montreal Exchange.


Leave a Reply