

This article is an update to the piece released on Monday:
US Oil breaks out as bearish catalysts fade
US Oil has indeed broken out of its downward trend amid progress in Ukraine-Russia talks, bolstering prospects from bulls of a lesser supply.
However, with Markets awaiting for an actual solution to the conflict, supplemented by anticipation for more economic talks from the FED and other Central Banks at the upcoming Jackson Hole Symposium, the mood looks to be for consolidation.
Despite rumours of a ceasefire in the Middle East, we haven’t seen much progress from that side also; Iran also contributes to elevate Supply.
This morning’s candle shows a failed attempt to trade higher with ongoing trading still trying to find direction.
All things considered, rangebound markets should dominate technicals until more news are published, so let’s discover what the current range is and how to exploit it the best.
And don’t forget to stay in touch with the latest news on ceasefires and everything else on Marketpulse!
US Oil Technical Analysis
US Oil Daily Chart
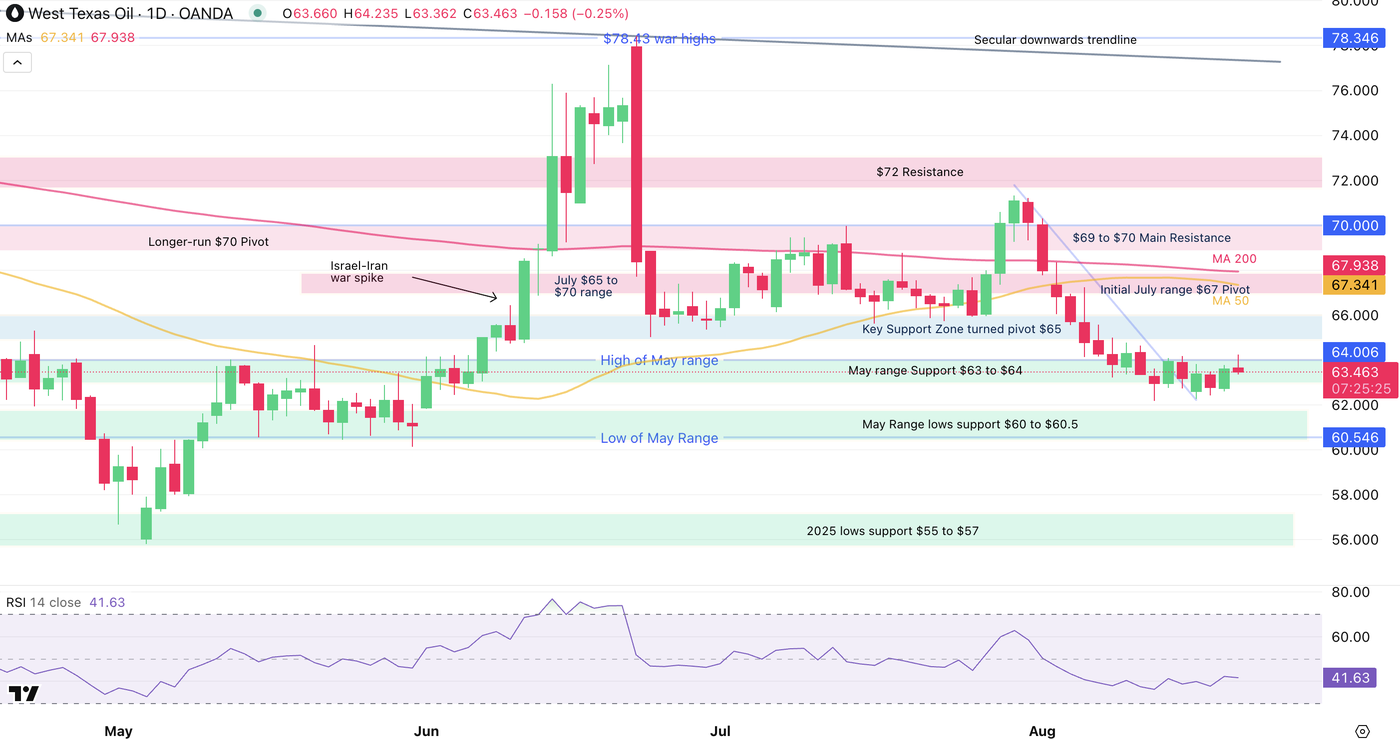
We are on the 7th consecutive day of consolidation in the Commodity.
The price action does seem to have found technical support however, with prices failing to hold the downward trendline from the end of July and the Daily RSI making higher lows.
Additionally, the key Daily Moving Averages are holding $3 higher from the price action (for example, the 50-Day MA is at $67.30).
Higher timeframe MAs tend to act as magnets in rangebound trading, but bulls will first have to show more strength.
Let’s have a closer look.
US Oil 4H Chart
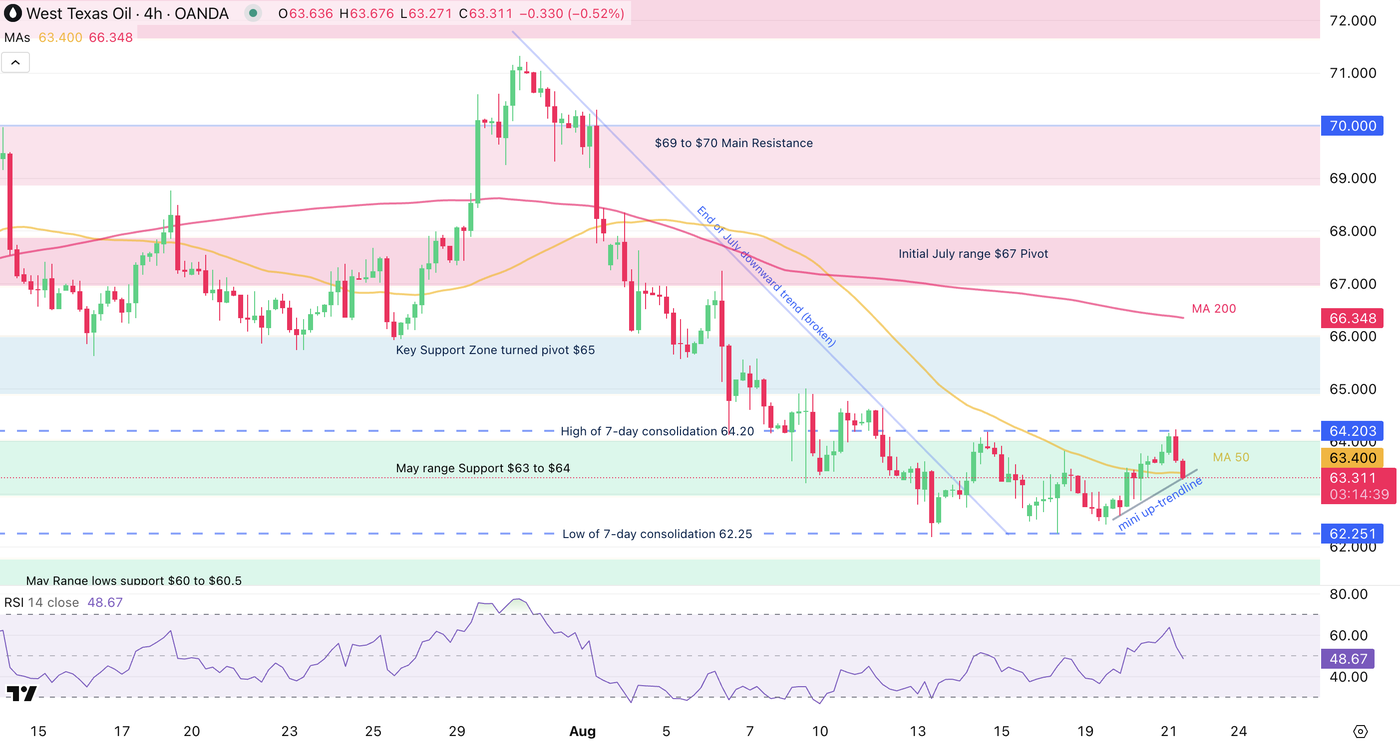
We see further detail of the ongoing consolidation held between $62.20 lows to $64.25 highs.
Buyers are trying to build momentum at an ongoing mini-upward trendline – with the 4H 50-period MA acting as immediate support (63.40), it will be essential to spot if they manage to provide more direction.
A failure to hold the trendline and Moving average would point to more consolidation.
Level to place on your WTI Charts:
Resistance Levels
- $64 to $64.20 consolidation highs
- $66 to $67 Mid-range level
- high range resistance $67.30 to $68 – Confluence with 50 and 200 Day MAs
Support Levels
- $62.00 to $62.50 consolidation support
- Wednesday lows $62.19 (current double bottom)
- $60.5 Low of May Range
- $55 to $57 2025 lows Main support
US Oil 1H Chart
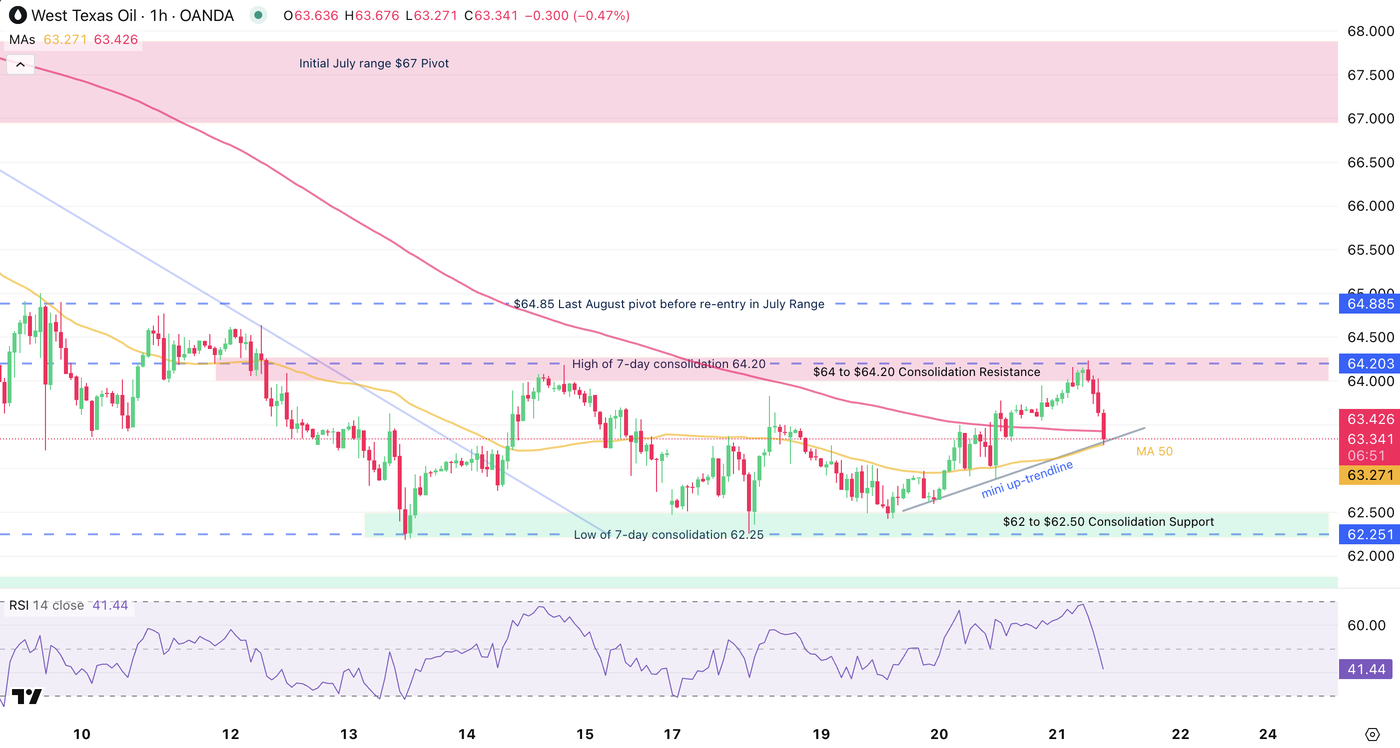
Looking even closer to the 1H timeframe, we spot how the extremes of the consolidation have acted as bounds for the rangebound trading.
The $64 to $64.20 level is acting as Resistance and the $62 to $62.50 is acting as Consolidation Support.
Any breakout from there would lead to higher chances of breakouts, with prolonged consolidation usually leading to built positioning at current levels, leading to precipitated covering.
A break above $64.85 would magnify the odds of a July range re-integration (between $65 to $70.5.
Safe Trades!
Opinions are the authors’; not necessarily that of OANDA Business Information & Services, Inc. or any of its affiliates, subsidiaries, officers or directors. The provided publication is for informational and educational purposes only.
If you would like to reproduce or redistribute any of the content found on MarketPulse, an award winning forex, commodities and global indices analysis and news site service produced by OANDA Business Information & Services, Inc., please refer to the MarketPulse Terms of Use.
Visit https://www.marketpulse.com/ to find out more about the beat of the global markets.
© 2025 OANDA Business Information & Services Inc.
About the Author

Elior Manier
Market Analyst
Elior brings over seven years of experience in financial markets to our analyst team. Since 2018, he has actively engaged in observing, charting, and trading, driven by his passion for mastering market dynamics. With a profound understanding of the geopolitical and macroeconomic forces that shape market movements, Elior focuses on analysing the impact of breaking news, market sentiment, and critical economic data releases on trading flows.
As a versatile analyst, he contributes powerful insights to the team, effectively integrating geopolitical and technical analysis to provide clear and comprehensive market perspectives.
Prior to joining our team, Elior honed his expertise as a Fixed Income Trader and Market Analyst at the Montreal Exchange.


Leave a Reply