

Since our most recent analysis, the energy commodity has kept struggling, but it seems that some change is happening.
Yesterday’s rebound looks to have carved out an intermediate bottom after Wednesday’s dragonfly doji (which you may discover on the charts).
Oil’s slide in recent weeks has been less about fresh supply or demand shocks and more about the market’s inability to find better hopes for global growth amid growing supply.
All eyes are on today’s high-stakes meeting between Trump and Putin in Anchorage around 15:00 ET. The Russian president praised the “sincere efforts” of his US counterpart ahead of the talks.
The geopolitical backdrop has now taken center stage, as recent oil data offered no real surprises to shift the narrative.
Is a bottom now in place?
If the meeting delivers better-than-expected results, that could become reality, potentially sparking a buy-the-news rally and breathing some newfound volatility in the commodity.
WTI Oil Technical Levels ahead of the Trump–Putin Meeting
US Oil Daily Chart
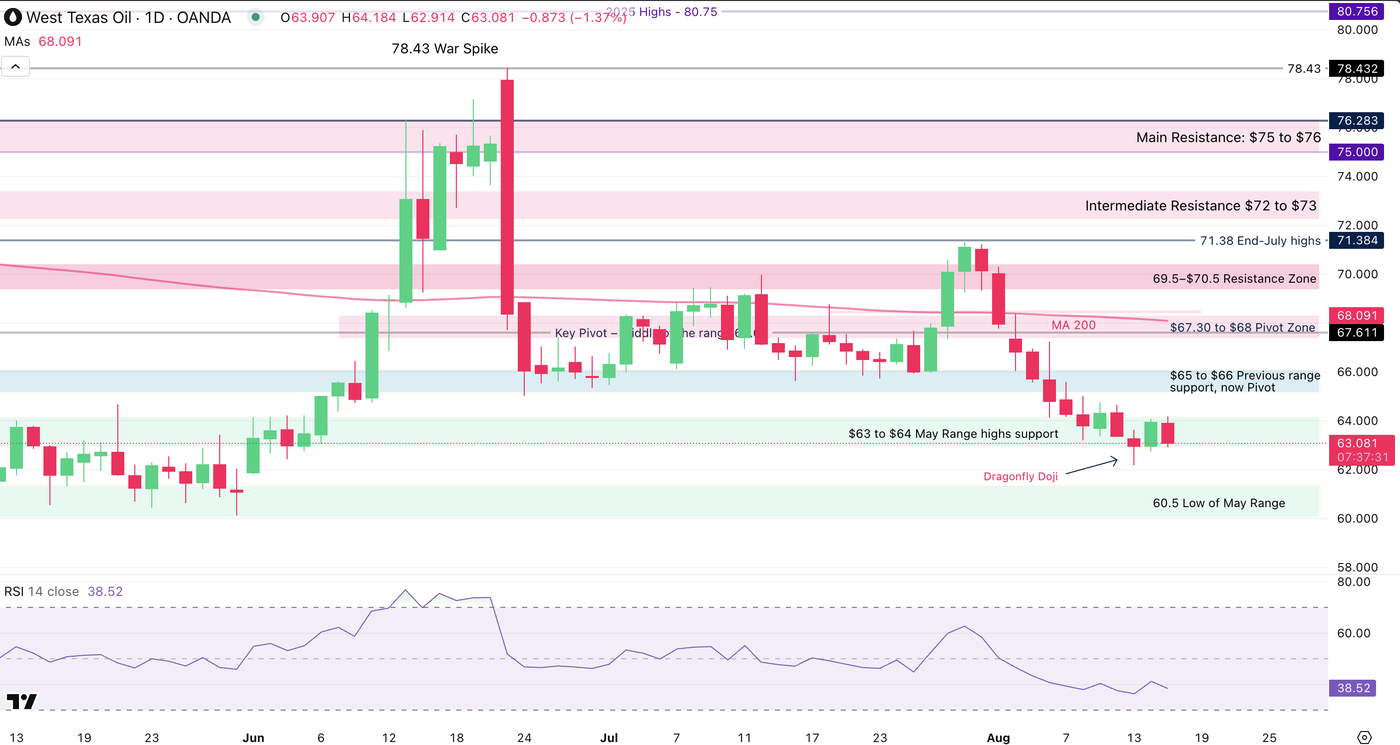
The past week had preceded a breakdown from the July range ($65 to $70.5) after about eight different crosses within the consolidation.
A failed breakout higher got met with a tight bear channel (where bear candles overlap each other) as global growth outlooks got revised lower from the NFP Payrolls and supply keeps getting increased with conflicting producing nations.
The drop, marking lows at 62.19 on Wednesday in the shape of the Dragonfly daily Doji has been followed by a decent bull candle yesterday now invalidating the tight bear channel formation.
The current Daily candle looks to engulf the one from yesterday, nonetheless, the session is young and the biggest catalyst has yet to show its results.
US Oil 4H Chart
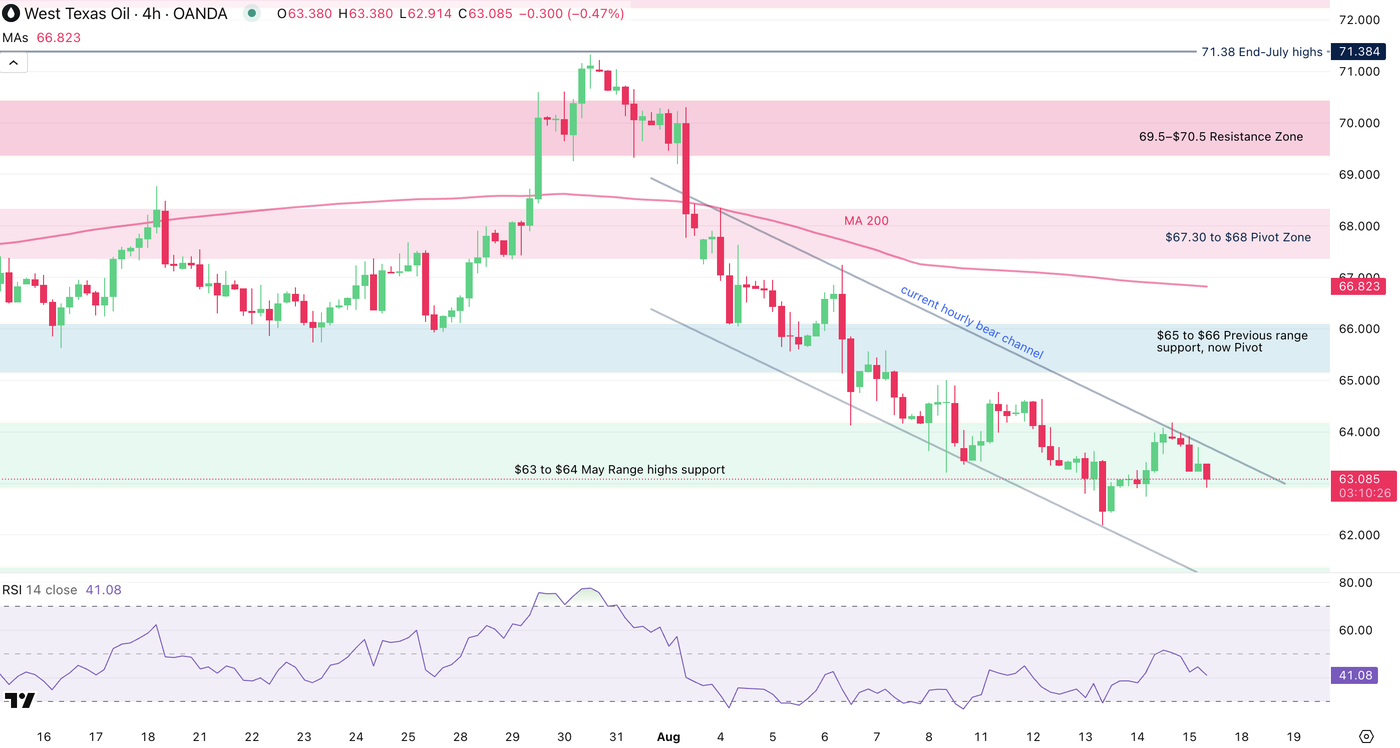
Sellers have taken control of the price action since August 1st as degrading data keeps hurting the commodity, already in the midst of supply-headwinds.
Watch how the ongoing bearish descending channel allowed to break the different July range levels , with prices now arriving right into the $63 to $64 May range highs Zone.
This morning saw some form of selling, which looks like position clearing ahead of the event – Markets tested the $63 psychological level and are consolidating since.
Levels to watch for US Oil:
Resistance Levels
- $65 to $66 Previous range support, now Pivot
- Imminent Pivot Zone $67.30 to $68 – Confluence with 50 and 200 Day MAs
- 69.5–$70.5 Resistance Zone, range extremes
Support Levels
- $63.00 to $64 May Range highs support
- Wednesday lows $62.19
- $60.5 Low of May Range
- $55 to $57 2025 lows Main support
US Oil 1H Chart
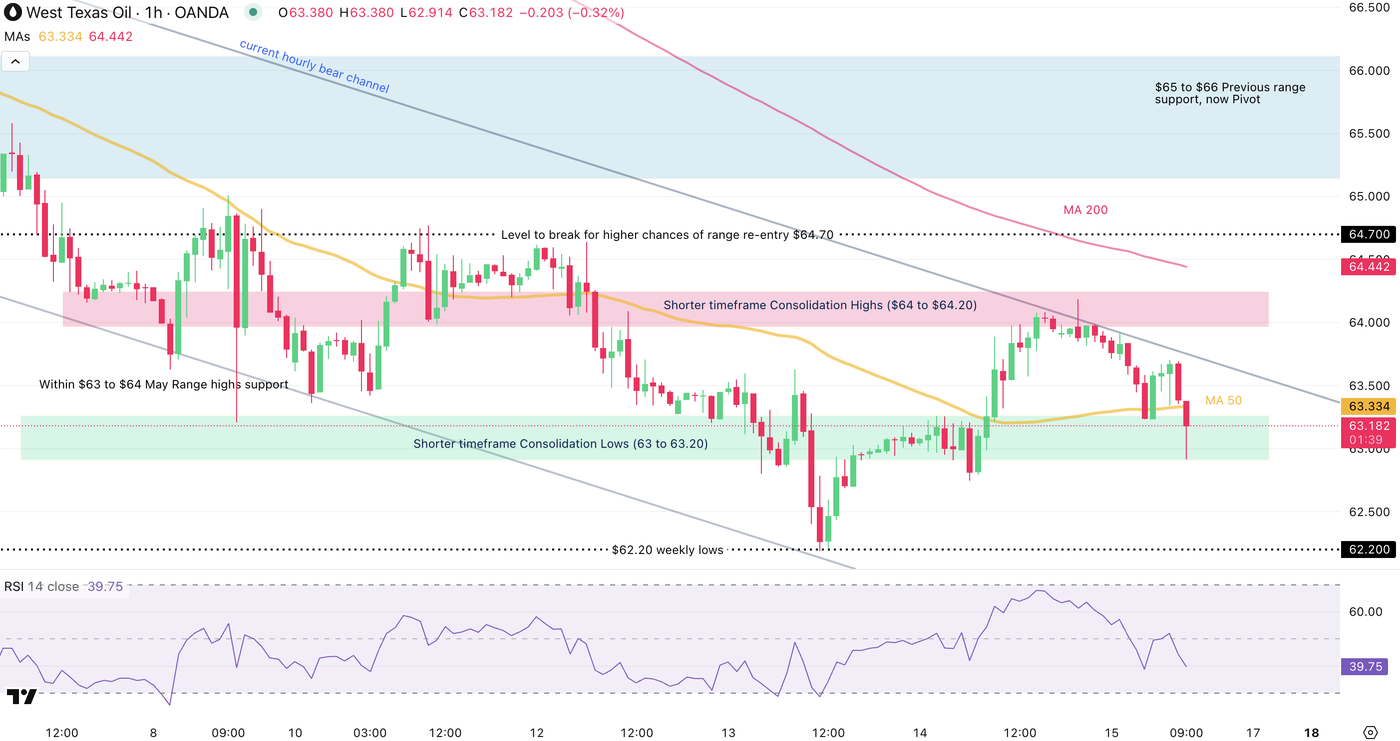
Looking even closer to the 1H timeframe we spot how the price action is consolidating within the $63 to $64 Support.
An ongoing short timeframe range is forming with $63 to $63.20 lows (currently trading) and with the highs located between $64 to $64.20, at a confluence with the highs of the descending channel.
Keep watching the headlines as the event approaches fast.
Safe Trades!
Opinions are the authors’; not necessarily that of OANDA Business Information & Services, Inc. or any of its affiliates, subsidiaries, officers or directors. The provided publication is for informational and educational purposes only.
If you would like to reproduce or redistribute any of the content found on MarketPulse, an award winning forex, commodities and global indices analysis and news site service produced by OANDA Business Information & Services, Inc., please refer to the MarketPulse Terms of Use.
Visit https://www.marketpulse.com/ to find out more about the beat of the global markets.
© 2025 OANDA Business Information & Services Inc.
About the Author

Elior Manier
Market Analyst
Elior brings over seven years of experience in financial markets to our analyst team. Since 2018, he has actively engaged in observing, charting, and trading, driven by his passion for mastering market dynamics. With a profound understanding of the geopolitical and macroeconomic forces that shape market movements, Elior focuses on analysing the impact of breaking news, market sentiment, and critical economic data releases on trading flows.
As a versatile analyst, he contributes powerful insights to the team, effectively integrating geopolitical and technical analysis to provide clear and comprehensive market perspectives.
Prior to joining our team, Elior honed his expertise as a Fixed Income Trader and Market Analyst at the Montreal Exchange.


Leave a Reply