

Price movements in the energy commodity markets are known to be volatile, with a huge number of factors influencing its supply and demand.
Between global economic activity fluctuating, OPEC+ countries trying to shake each others out, and persistent wars implying re-routed exports/imports, trying to understand each and every move is a daunting, almost impossible task.
But understanding movements is a task for historians, traders need to focus on the current course of action in an attempt to generate profits (and minimize losses that will always incur).
Over the preceding week, the Trump Administration repeated their discontent over Europe still purchasing Russian oil through different routes, pushing the joint economy to find alternatives.
This was a catalyst for a progressive yet explosive rise, taking prices from $62.20 lows on Monday to $67.80 highs Friday morning, a +7% move.
However, things would be too easy if they were as straightforward: A Friday morning selloff took the commodity down 2% from its highs, and the move is continuing today.
New export routes are re-opening with Iraq allowing Kurdish oil exports to Turkey after 2-and-a-half years of halt, adding even more supply to an oversupplied market.
Oil companies are seeing the pressure, with Total Energies announcing just a few moments ago they would sell their global assets and keeping only their Europe, US and Brazil postiions.
Let’s dive into some key charts for WTI Oil.
US Oil (WTI) technical analysis
US Oil Daily Chart
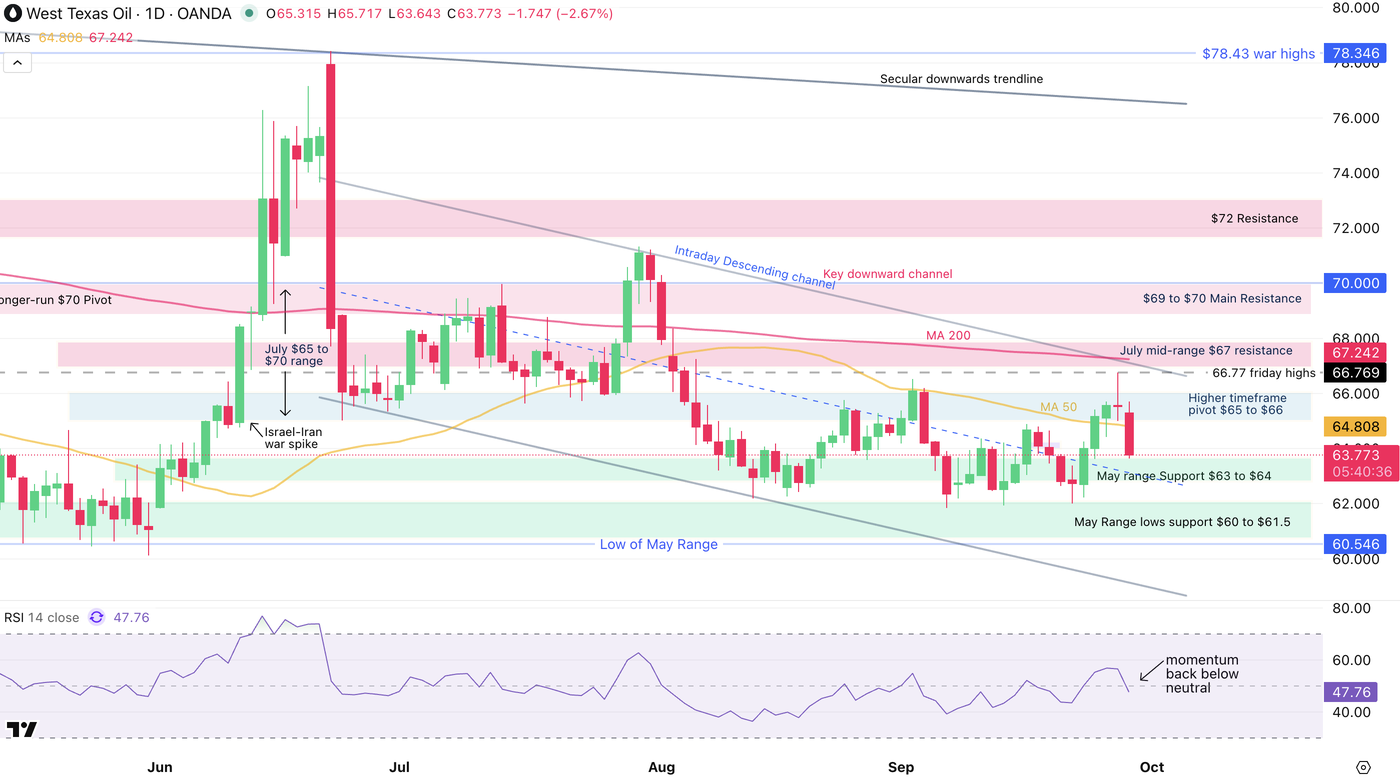
Despite the more rangebound action, bears keep shoving breakout attempts and remain in technical control.
Since the June War spike correction, prices have been forming downward steps in a consolidation – failed breakout – lower rejection pattern.
Prices are now back to test the May range highs that has been acting as key support, but will be subject to a momentum goes into bearish territory and the action still evolves in a downward channel.
Reactions to the current levels will be key to spot if buyers can generate a higher-low in prices. Failing to do so would confirm the ongoing $62 to $66 solid range.
Let’s take a closer look to get more details.
US Oil 2H Chart and levels
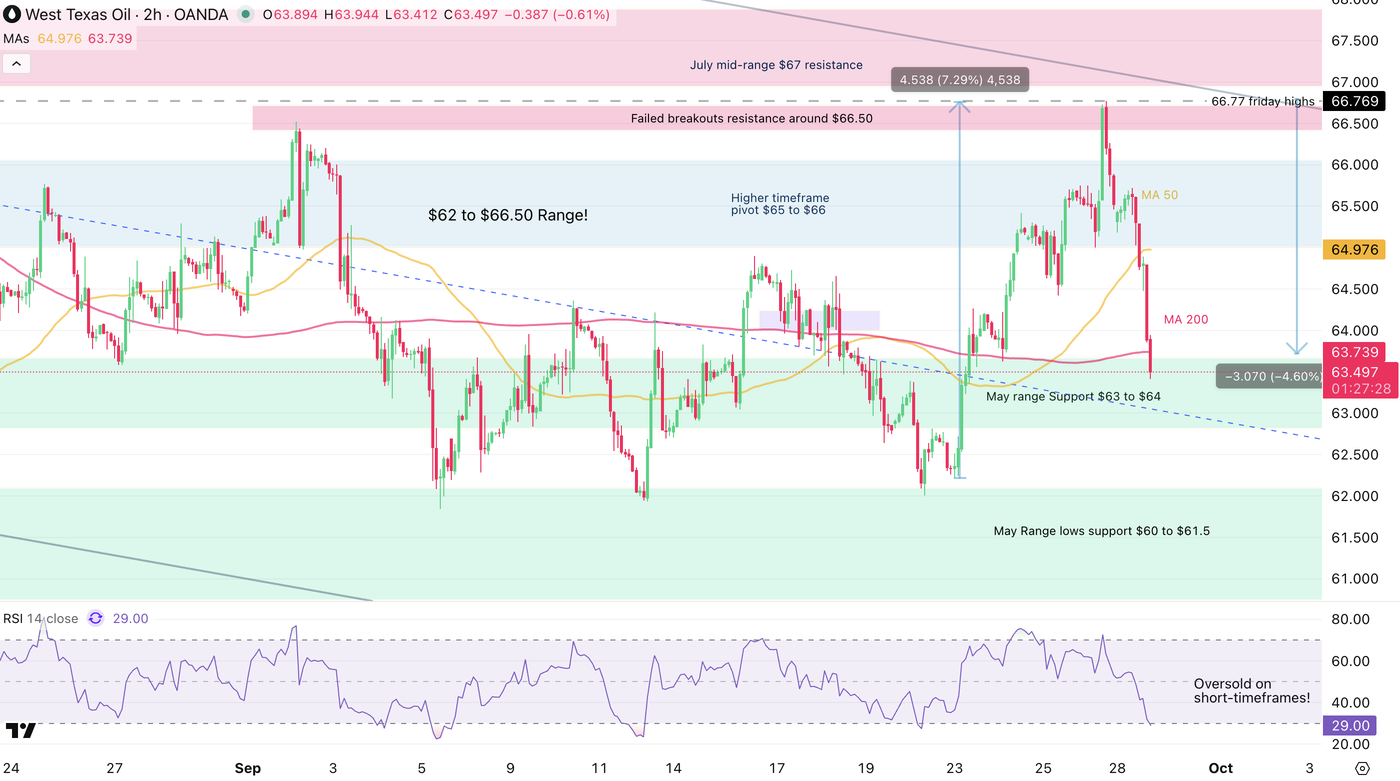
Our preceding oil market analysis had spotted a touch of the channel lower bound leading to a triple bottom rebound.
However, the new supply channel news have scared bulls again even before reaching the highs of the downward channel seen on the daily chart.
Momentum is now reaching oversold levels and reactions are now to be monitored closely.
With the $63 to $64 support zone coming into play, bulls will have to hold to maintain a more balanced technical outlook.
Failing to do so may lead to a repeat of the failed breakout into new lows pattern.
Levels to place on your WTI charts:
Resistance Levels
- Higher timeframe pivot $65 to $66
- Mini resistance $66.50
- Shorter timeframe Consolidation Highs ($64.35 to $65 testing)
- 50-Day MA $65.00
- July mid-range $67 resistance
Support Levels
- $63 to $64 support zone
- Shorter timeframe Consolidation Lows ($62 to 62.50)
- September lows $61.84 to $62
- $60.5 Low of May Range
Opinions are the authors’; not necessarily that of OANDA Business Information & Services, Inc. or any of its affiliates, subsidiaries, officers or directors. The provided publication is for informational and educational purposes only.
If you would like to reproduce or redistribute any of the content found on MarketPulse, an award winning forex, commodities and global indices analysis and news site service produced by OANDA Business Information & Services, Inc., please refer to the MarketPulse Terms of Use.
Visit https://www.marketpulse.com/ to find out more about the beat of the global markets.
© 2025 OANDA Business Information & Services Inc.
About the Author

Elior Manier
Market Analyst
Elior brings over seven years of experience in financial markets to our analyst team. Since 2018, he has actively engaged in observing, charting, and trading, driven by his passion for mastering market dynamics. With a profound understanding of the geopolitical and macroeconomic forces that shape market movements, Elior focuses on analysing the impact of breaking news, market sentiment, and critical economic data releases on trading flows.
As a versatile analyst, he contributes powerful insights to the team, effectively integrating geopolitical and technical analysis to provide clear and comprehensive market perspectives.
Prior to joining our team, Elior honed his expertise as a Fixed Income Trader and Market Analyst at the Montreal Exchange.


Leave a Reply