

- WTI Oil hangs around $95 right ahead of a high risk weekend
- Contentious geopolitics are still influencing Oil prices with Strait of Hormuz blockades still having their effect
- Exploring an in-depth Technical Analysis of the commodity
The weekend is here, and energy markets are holding their breath.
WTI Crude is hovering uncomfortably around the $95 mark as the geopolitical standoff between Washington and Tehran remains incredibly tense.
While Iran has already sent a delegation to Islamabad, they are actively playing hardball and have yet to officially confirm that they will actually sit down and exchange terms with the US representatives.
Despite this diplomatic stalemate, the US is still sending two of its top diplomats to Pakistan with Steve Witkoff and Jared Kushner.
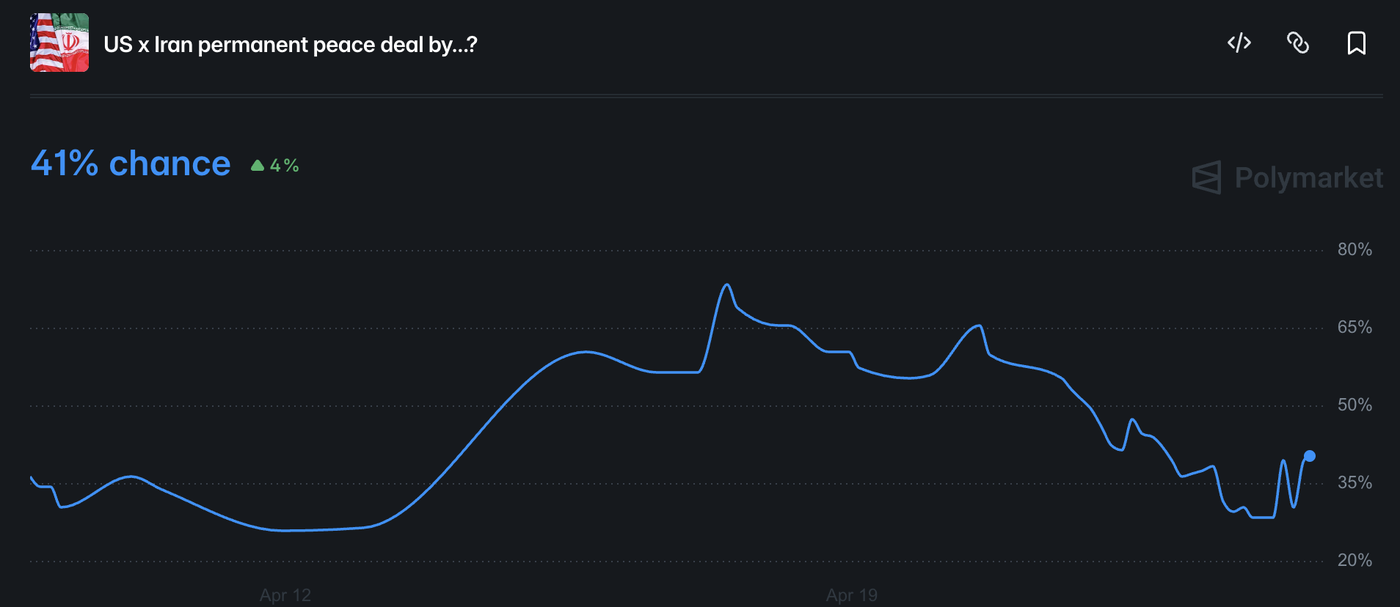
Market participants will be watching the wire like hawks, desperately wanting to see concrete progress toward a finalized peace deal this weekend to avoid a massive gap on Monday’s open.
Odds for a Peace deal went down quite aggressively since last Friday, and that doesn’t bode well for general Market sentiment.
In the meantime, the Trump administration is still applying pressure on Iran to force a deal. The US Navy is maintaining a heavy maritime blockade on the Strait of Hormuz to completely prevent Iran from exploiting its geographic monopoly over the region.
The blockade is in full force and the US military has blocked 34 tankers coming from Iranian ports, severely tightening the economic chokehold on Tehran.
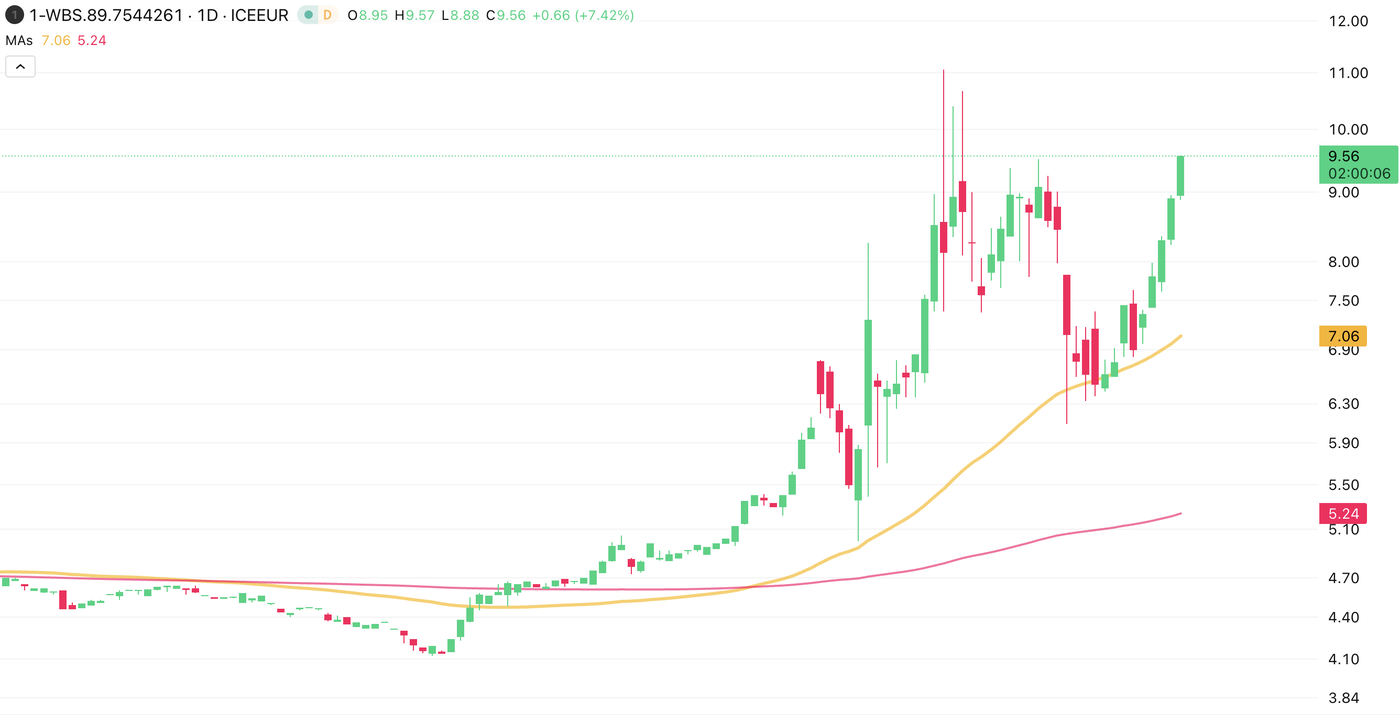
While global oil traffic is slowly redirecting toward North America—which is currently driving a still increasing $11 per barrel difference between WTI and Brent—global supply is still taking a severe hit.
With alternative pipelines still in the slow process of reopening, the International Energy Agency notes that the market is currently facing a still huge 13 million barrels per day drought compared to normal global flows.
While slightly better economic fundamentals originally helped cool the extreme war premium, it turns out that the overarching narrative remains heavily blurry.
Traders are still wondering exactly where to look, which is directly translating into a highly choppy and seesawing price action.
As the situation has little odds to get more clear ahead of the weekend, let’s dive into a multi-timeframe analysis of WTI (US) Oil to determine levels of interest and put the odds in the trader’s favor to capitalize on the issue.
US Oil Multi-Timeframe Analysis
WTI Daily Chart
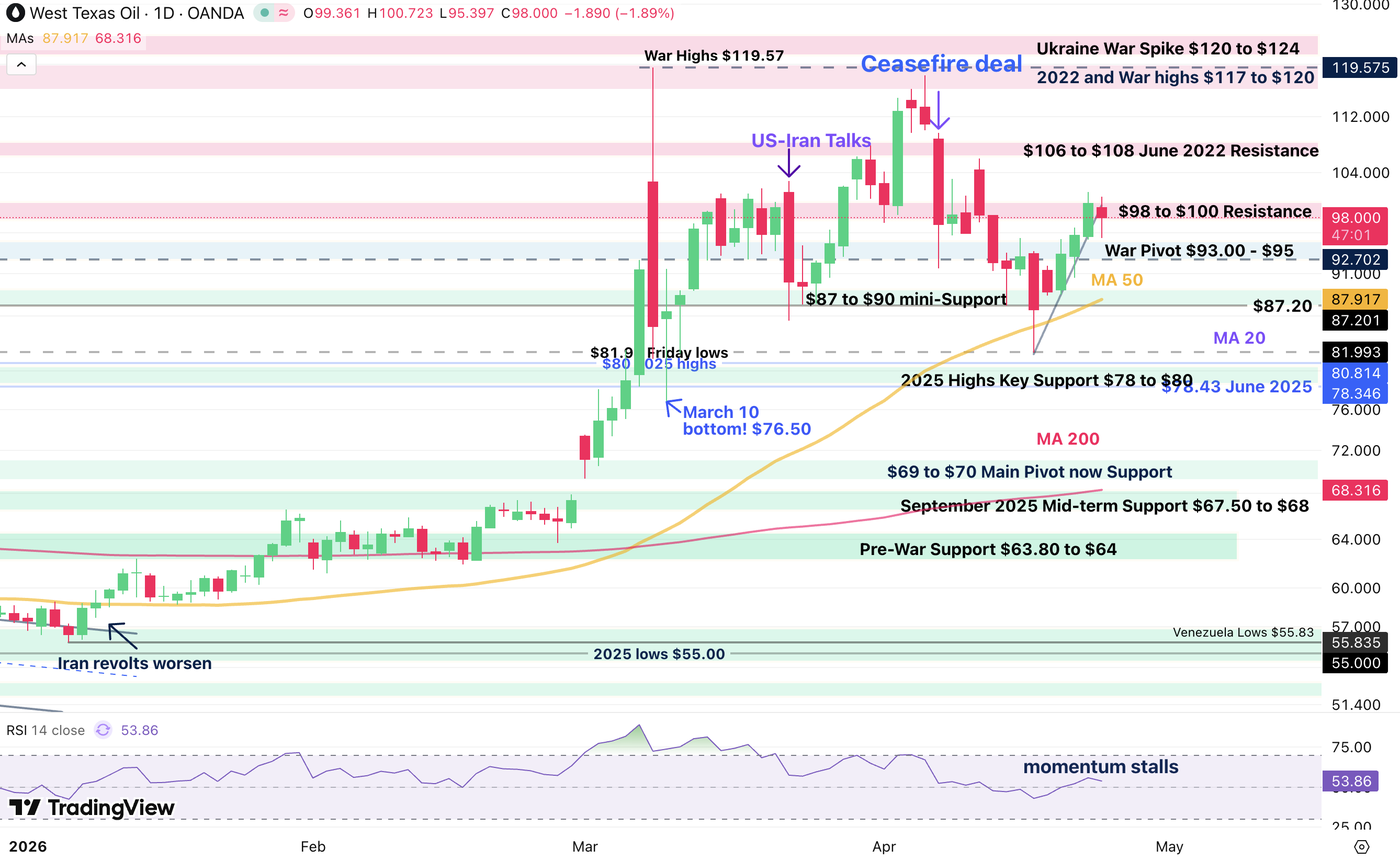
After correcting to $83 lows just last Friday, sellers just couldn’t maintain the high pressure fundamentals and this led to a 3-day bounce right back below the $100 level.
As long as prices don’t exceed that threshold, Markets should remain contained, but keep a close eye on that level as breaching it could lead to a large spike in volatility.
Let’s take a closer look.
WTI 4H Chart and Technical Levels
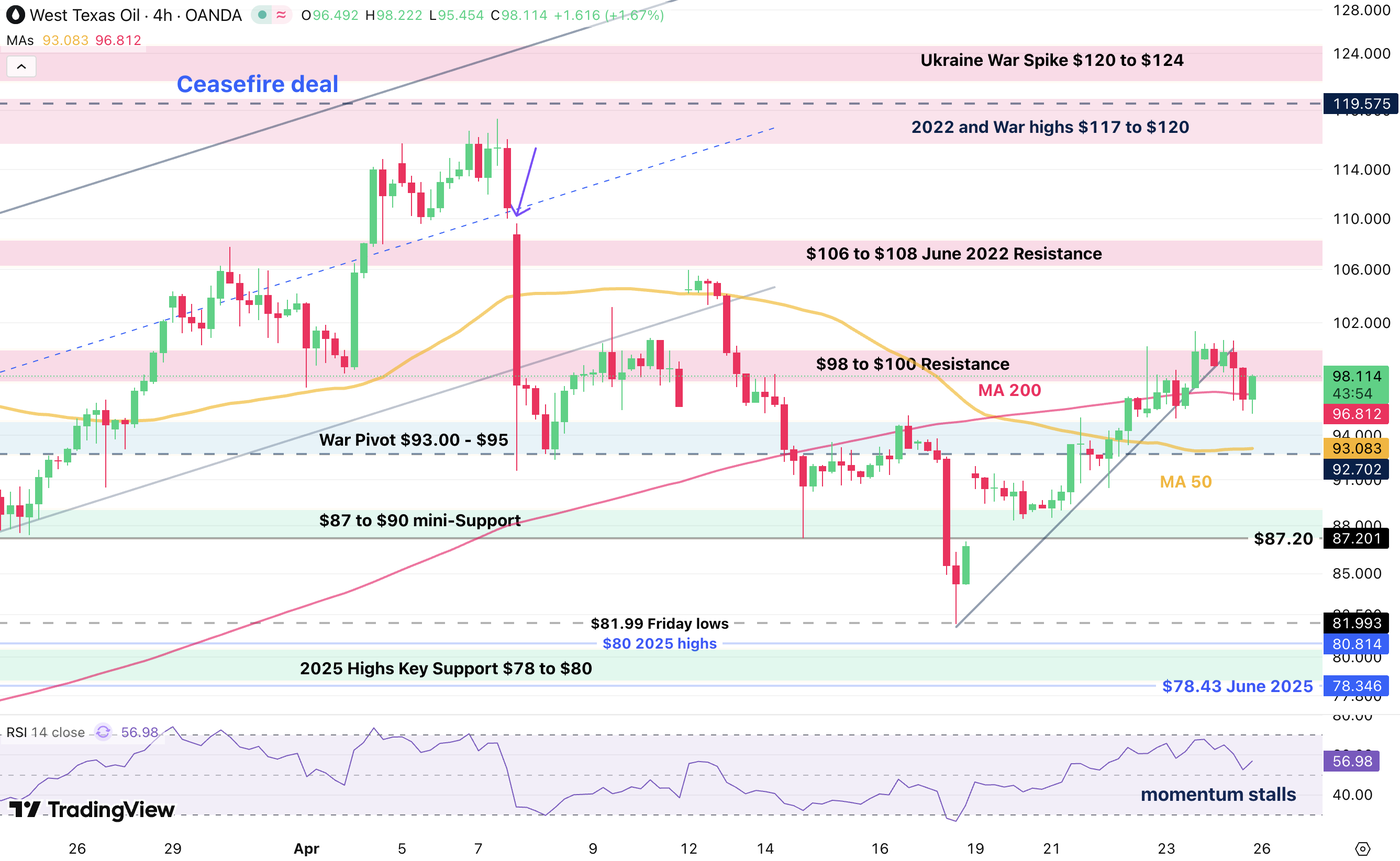
While sellers reappeared at the $98 to $100 resistance, they could not extend the pressure below the 4H 200-period MA ($96.82).
The moving average is a key indicator to keep your eyes on to gauge intraday momentum in the commodity.
WTI Technical Levels:
Resistance Levels
- $98 to $100 Resistance (freshly rejected)
- $104 next-mini resistance
- $106 to $108 June 2022 Resistance
- 2022 and Monday highs $117 to $120 (larger channel top)
- Ukraine War Spike $120 to $124
Support Levels
- 4H 200-period MA $96.82
- War Support $93.00 – $95
- $87 to $90 mini-Support (recent bounce)
- $82.80 to $84 micro-Support
- 2025 Highs Key Support $78 to $80
- $69 to $70 Final War Support
1H Chart and action levels
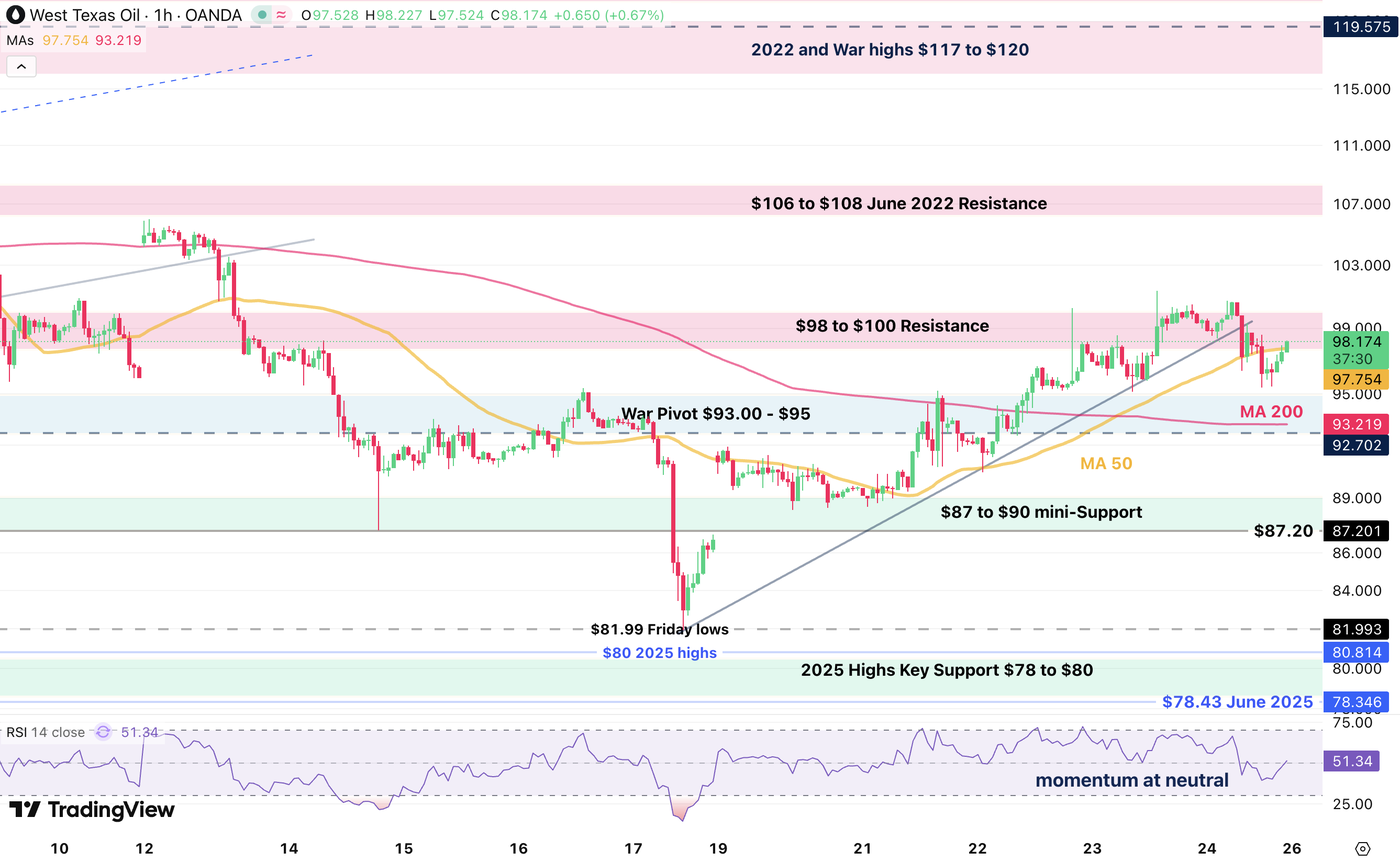
While pre-weekend action brought bullish pressure to the upside, having broken the weekly upward trendline hints at a more balanced action ahead.
Breaking $100 should see follow through all the way to $104, and the next step is at $106.
On the other hand, rejecting below $97 marks higher chances of a $93 retest.
Expect high-volatility gaps on Monday’s session – Trading these could require savvy stop-orders. With heavy binary risk, make sure to keep your size under control.
Safe Trades and an enjoyable weekend!
Follow Elior on Twitter/X for additional Market News, Insights and Interactions @EliorManier
Opinions are the authors’; not necessarily that of OANDA Business Information & Services, Inc. or any of its affiliates, subsidiaries, officers or directors. The provided publication is for informational and educational purposes only.
If you would like to reproduce or redistribute any of the content found on MarketPulse, an award winning forex, commodities and global indices analysis and news site service produced by OANDA Business Information & Services, Inc., please refer to the MarketPulse Terms of Use.
Visit https://www.marketpulse.com/ to find out more about the beat of the global markets.
© 2026 OANDA Business Information & Services Inc.
About the Author

Elior Manier
Market Analyst
Elior brings over seven years of experience in financial markets to our analyst team. Since 2018, he has actively engaged in observing, charting, and trading, driven by his passion for mastering market dynamics. With a profound understanding of the geopolitical and macroeconomic forces that shape market movements, Elior focuses on analysing the impact of breaking news, market sentiment, and critical economic data releases on trading flows.
As a versatile analyst, he contributes powerful insights to the team, effectively integrating geopolitical and technical analysis to provide clear and comprehensive market perspectives.
Prior to joining our team, Elior honed his expertise as a Fixed Income Trader and Market Analyst at the Montreal Exchange.


Leave a Reply