

Key takeaways
- Global equity markets, led by Nasdaq 100, S&P 500, Nikkei 225, and KOSPI, climbed to fresh record highs as AI-driven optimism continued to overpower geopolitical concerns surrounding the fragile US-Iran ceasefire.
- Rising oil prices, stronger inflation expectations, and hawkish Federal Reserve rhetoric reinforced the “higher-for-longer” interest rate narrative, pushing US Treasury yields higher and supporting broad US dollar strength.
- Chart of the day: The Hang Seng Index maintained a constructive bullish structure after rebounding from its 20-day moving average, with momentum indicators suggesting potential upside continuation above the 26,210/100 support zone.
Top macro headlines
- US-Iran ceasefire ‘on life support’: US President Donald Trump stated the ceasefire with Iran is fading, dashing hopes for an imminent peace deal after rejecting Iran’s recent proposal as “unacceptable” over the weekend.
- Global stocks reach record highs: Major indices, including the S&P 500, Nasdaq 100, Nikkei 225, and KOSPI, powered to new record highs as the “artificial intelligence fever” vastly outweighed concerns over Middle East supply shocks.
- Alphabet and Amazon tap overseas debt: Tech giants are issuing debt in lower-yielding currencies like the Japanese yen and Swiss francs to fund massive AI infrastructure buildouts without draining cash reserves.
- Trump heads to China for crucial summit: President Trump and Chinese President Xi Jinping are set for comprehensive talks spanning Iran, nuclear issues, trade, and AI, accompanied by a large entourage of US corporate titans from companies like Tesla, Apple, and BlackRock.
- US CPI data looms: Markets brace for Tuesday’s crucial April CPI report, with headline inflation expected to jump to 3.7% y/y (from 3.3%) primarily due to the energy price shock caused by the ongoing Strait of Hormuz closure.
Key macro themes
- AI fever overpowers geopolitics: Record US equity prices are coexisting with elevated oil and rising yields. According to BlackRock, markets are comfortably pricing in both AI-driven growth and the impact of the Middle East supply shock, remaining heavily “pro-risk” despite the chaos.
- Extreme market concentration: Top-heavy indices have become a global feature. The top 10 US stocks now account for 33% of the overall market value. [cite: 2] Meanwhile, single tech champions like Samsung and TSMC make up roughly 20% and 40% of their respective national indices.
- Inflation and hawkish Fed risks: With inflation metrics heating up and oil surging, Chicago Fed President Austan Goolsbee warned that the future of monetary policy could actually include interest rate increases, fundamentally challenging recent rate-cut hopes.
Global market impact (last 24 hours)
Equities: The S&P 500 and Nasdaq closed at new record highs. [cite: 2] The tech sector gained 1%, and energy rallied 2.6%, while the Philadelphia semiconductor index reached a new peak (+2.6%).
Fixed Income: US Treasury yields climbed, with a 6 basis point rise at the short end bear steepening the curve as a 3-year auction drew weak demand.
FX: The US Dollar inched higher, with the Japanese Yen serving as the biggest G10 decliner. Emerging market currencies like the Indian Rupee and South Korean Won dropped sharply on dollar strength and high energy costs.
Commodities: Oil surged 3% (jumping $3/barrel) as the Strait of Hormuz remains largely closed. Silver rallied 7% to hit a 2-month high at $86.10/oz, outperforming Gold, which only recorded a modest gain of 0.4% due to a rebound in US Treasury yields.
Asia Pacific impact
- Stock markets: Regional markets broadly surged. The Nikkei, KOSPI, and MSCI Asia ex-Japan indices all hit new record highs. China’s A-share market reached an 11-year high following a positive data dump showing surging export growth.
- Currencies: The region experienced broad weakness against the USD. The Yen (-0.3%) and Won (-1%) declined despite the massive regional equity rally.
- Economic outlook: China’s latest trade data showed a widening trade surplus and rising price pressures in April, suggesting the economy is moving out of disinflation, though unemployment ticked up.
Top 3 data/events to watch today
- AU NAB Business Confidence (Apr) – 9.30 am SGT Impact: AUD/USD, AUD crosses, ASX 200
- Eurozone ZEW Economic Sentiment (May) – 5.00 pm SGT (consensus:- 20, Apr:-20) Impact: EUR/USD. EUR crosses, DAX
- US Core Inflation (Apr) – 8.30 pm SGT (consensus: 2.7% y/y, Mar: 2.6% y/y) Impact: All asset classes
Chart of the day – Hang Seng Index rebounded from 20-day MA
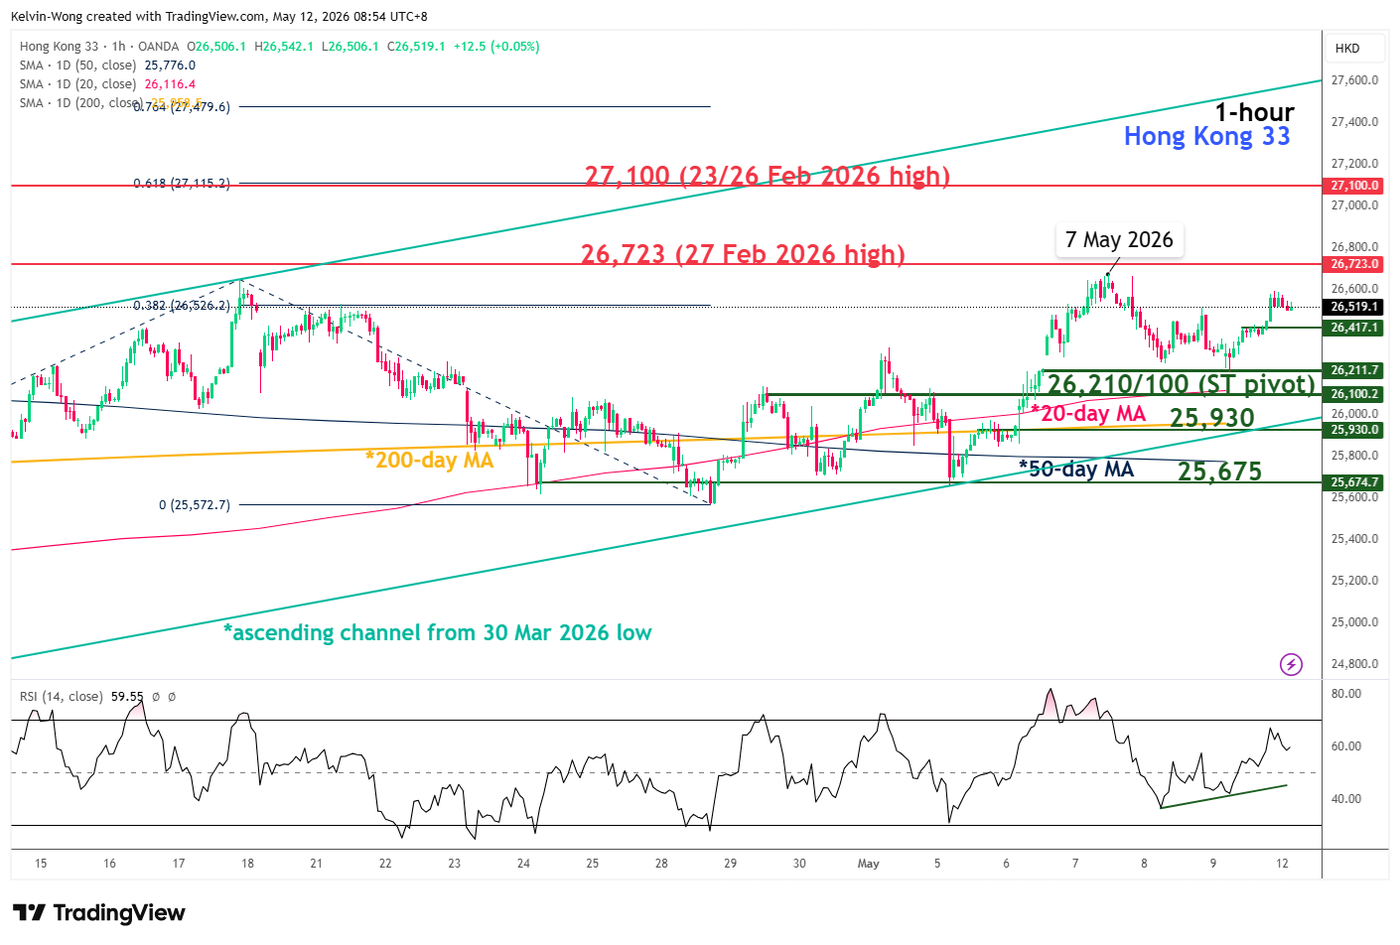
The price actions of the Hong Kong 33 (a proxy of the Hang Seng Index futures) have managed a minor bullish reversal right above its 20-day moving average after a 1.7% decline from the 7 May 2026 intraday high of 26,634.
The overall price structure remains bullish as it continues to oscillate within a medium-term ascending channel in place since the 30 March 2026 low.
In addition, the hourly RSI momentum indicator has exhibited bullish momentum conditions as it continues to be supported by an ascending trendline above the 50 level and has not reached its overbought zone (above the 70 level).
Watch the 26,210/100 key short-term pivotal support to maintain a potential bullish bias. A clearance above 26,723 sees the next intermediate resistance coming in at 27,100 (also a Fibonacci extension) (see Fig. 1).
On the other hand, failure to hold and an hourly close below 26,100 jeopardizes the bullish tone for a slide to retest the next intermediate support at 25,930 (also the key 200-day moving average).
Opinions are the authors’; not necessarily that of OANDA Business Information & Services, Inc. or any of its affiliates, subsidiaries, officers or directors. The provided publication is for informational and educational purposes only.
If you would like to reproduce or redistribute any of the content found on MarketPulse, an award winning forex, commodities and global indices analysis and news site service produced by OANDA Business Information & Services, Inc., please refer to the MarketPulse Terms of Use.
Visit https://www.marketpulse.com/ to find out more about the beat of the global markets.
© 2026 OANDA Business Information & Services Inc.
About the Author

Kelvin Wong
Senior Market Analyst
Based in Singapore, Kelvin Wong is a well-established senior global macro strategist with over 15 years of experience trading and providing market research on foreign exchange, stock markets, and commodities.
Passionate about connecting the dots in the financial markets and sharing perspectives around trading and investment, Kelvin Wong is an expert in using a unique combination of fundamental and technical analyses, specializing in Elliott Wave and fund flow positioning, to pinpoint key reversal levels in the financial markets.
In addition, over the last ten years, Kelvin has conducted numerous market outlook and trading-related seminars, as well as technical analysis training courses, for thousands of retail traders.


Leave a Reply